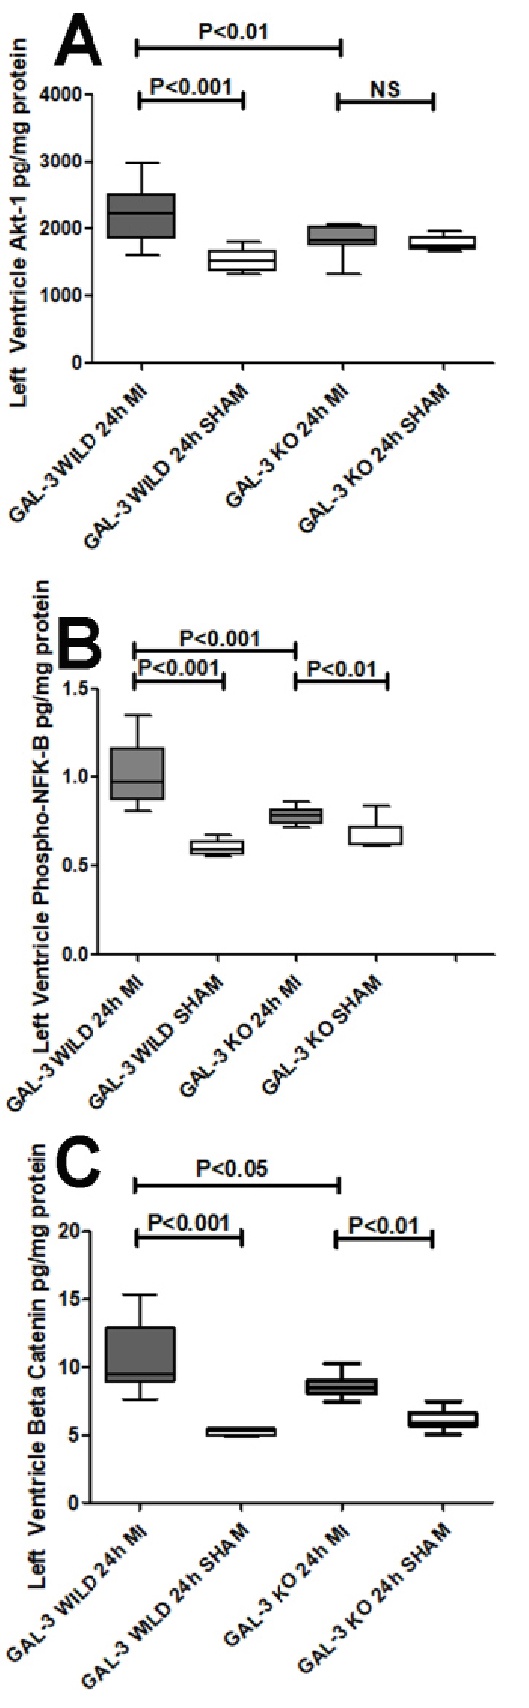
Fig. 6. A. The graph represents Total Akt-1 concentrations (pg/mg) at 24-hour post myocardial infarction in wild type C57BL6 and GAL-3 KO mouse heart. B. The graph represents phospho-NF kappa-B concentrations (pg/mg) at 24-hour post myocardial infarction in wild type C57BL6 and GAL-3 KO mouse heart. C. The graph represents beta-catenin concentrations (pg/mg) at 24-hour post myocardial infarction in wild type C57BL6 and GAL-3 KO mouse heart. Note: P value<0.05 is considered statistically significant.